Note
Click here to download the full example code
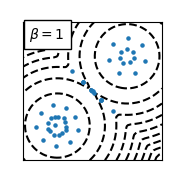
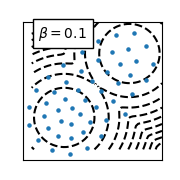
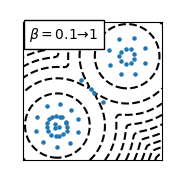
Effect of annealing
Out:
/home/circleci/project/examples/plot_temperature.py:104: UserWarning: The following kwargs were not used by contour: 'linestyle'
  plt.contour(X, Y, Z, levels=10, colors="k", linestyle="dotted")
# Author: Pierre Ablin <pierre.ablin@ens.fr>
#
# License: MIT

import torch
from ksddescent import ksdd_lbfgs
import matplotlib.pyplot as plt
import numpy as np

torch.manual_seed(1)


def make_mog(centers, vars, weights):
    weights = torch.tensor(weights)
    weights /= weights.sum()

    def score(x):
        den = 0
        top = 0
        for center, var, weight in zip(centers, vars, weights):
            exp = torch.exp(-0.5 * ((x - center) ** 2).sum(axis=1) / var)
            den += weight * exp
            top += weight * exp[:, None] * (x - center) / var
        return -top / den[:, None]

    def potential(x):
        op = 0.0
        for center, var, weight in zip(centers, vars, weights):
            exp = torch.exp(-0.5 * ((x - center) ** 2).sum(axis=1) / var)
            op += weight * exp
        return torch.log(op)

    def sampler(n_samples):
        x = []
        for c, v, w in zip(centers, vars, weights):
            z = torch.randn(int(n_samples * w), 2)
            z *= np.sqrt(v)
            z += c
            x.append(z.clone())
        return torch.cat(x)

    return score, potential, sampler


var = 0.1
fac = 0.5
centers = [
    torch.tensor([-1.0, -1.0]),
    torch.tensor([1.0, 1]),
    torch.tensor([1, -1]),
]
variances = [var, var]
weights = [0.5, 0.5]

score, potential, sampler = make_mog(centers, variances, weights)

n_samples = 50
p = 2

x = torch.randn(n_samples, p) / 3

beta = 0.1


def score_beta(x):
    return beta * score(x)


bw = 0.1
noise_level = 0.1
step = 0.01
x_direct = ksdd_lbfgs(x, score, kernel="gaussian", bw=bw).detach()
x_final = ksdd_lbfgs(x, score_beta, kernel="gaussian", bw=bw).detach()
x_final2 = ksdd_lbfgs(x_final, score, kernel="gaussian", bw=bw).detach()

for x, method, label in zip(
    [x_direct, x_final, x_final2],
    ["direct", "hightemp", "lowtemp"],
    [r"$\beta=1$", r"$\beta=0.1$", r"$\beta=0.1 \to 1$"],
):
    plt.figure(figsize=(1.8, 1.8))
    s = 5
    plt.scatter(x[:, 0], x[:, 1], s=s, zorder=10)
    plt.text(
        -1.8,
        1.5,
        label,
        color="k",
        bbox=dict(facecolor="white", edgecolor="k", alpha=1),
    )

    x_ = np.linspace(-2.0, 2.0)
    y_ = np.linspace(-2.0, 2.0)
    X, Y = np.meshgrid(x_, y_)
    XX = torch.tensor(np.array([X.ravel(), Y.ravel()]).T)
    Z = potential(XX).reshape(X.shape).detach().numpy()

    plt.contour(X, Y, Z, levels=10, colors="k", linestyle="dotted")
    plt.tick_params(
        axis="both",
        which="both",
        bottom=False,
        top=False,
        labelbottom=False,
        left=False,
        right=False,
        labelleft=False,
    )
plt.show()
Total running time of the script: ( 0 minutes 1.041 seconds)