Note
Click here to download the full example code
Using a custom density with Picard
This example shows how to use custom densities using Picard
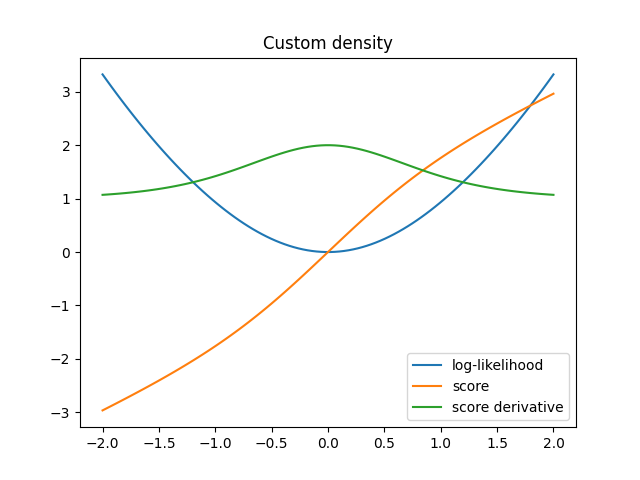
Build a custom density where the score function is x + tanh(x)
Plot the corresponding functions
x = np.linspace(-2, 2, 100)
log_likelihood = custom_density.log_lik(x)
psi, psi_der = custom_density.score_and_der(x)

names = ['log-likelihood', 'score', 'score derivative']

plt.figure()
for values, name in zip([log_likelihood, psi, psi_der], names):
    plt.plot(x, values, label=name)
plt.legend()
plt.title("Custom density")
plt.show()
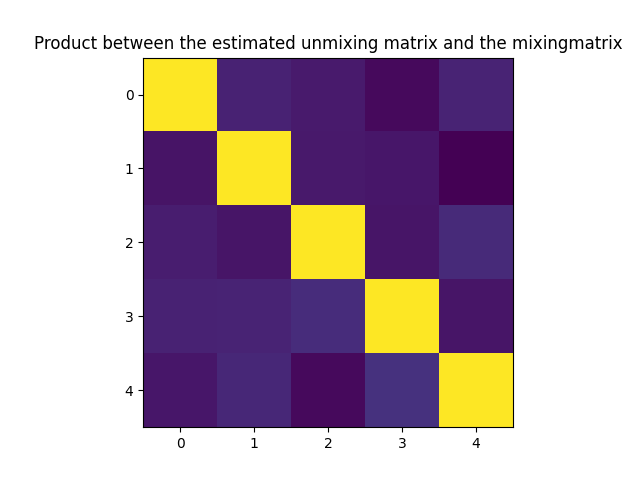
Run Picard on toy dataset using this density
rng = np.random.RandomState(0)
N, T = 5, 1000
S = rng.laplace(size=(N, T))
A = rng.randn(N, N)
X = np.dot(A, S)
K, W, Y = picard(X, fun=custom_density, random_state=0)
plt.figure()
plt.imshow(permute(W.dot(K).dot(A)), interpolation='nearest')
plt.title('Product between the estimated unmixing matrix and the mixing'
          'matrix')
plt.show()
Total running time of the script: ( 0 minutes 0.264 seconds)
