Note
Click here to download the full example code
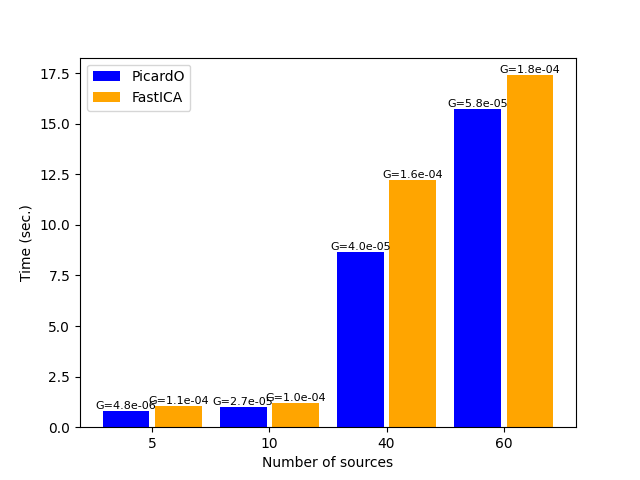
Comparison of Picard-O and FastICA on faces data
This example compares FastICA and Picard-O:
Pierre Ablin, Jean-François Cardoso, Alexandre Gramfort “Faster ICA under orthogonal constraint” ICASSP, 2018 https://arxiv.org/abs/1711.10873
On the figure, the number above each bar corresponds to the final gradient norm.
# Author: Pierre Ablin <pierre.ablin@inria.fr>
#         Alexandre Gramfort <alexandre.gramfort@inria.fr>
# License: BSD 3 clause


import numpy as np
from time import time
import matplotlib.pyplot as plt
from sklearn.datasets import fetch_olivetti_faces
from sklearn.decomposition import fastica

from picard import picard


print(__doc__)

image_shape = (64, 64)
rng = np.random.RandomState(0)


def gradient_norm(Y):
    psiY = np.tanh(Y)
    psidY_mean = 1 - np.mean(psiY ** 2, axis=1)
    g = np.dot(psiY, Y.T) / Y.shape[1]
    signs = np.sign(psidY_mean - np.diag(g))
    g *= signs[:, None]
    g = (g - g.T) / 2
    return np.linalg.norm(g)
Load faces data
dataset = fetch_olivetti_faces(shuffle=True, random_state=rng)
faces = dataset.data

n_samples, n_features = faces.shape

# global centering
faces_centered = faces - faces.mean(axis=0)

# local centering
faces_centered -= faces_centered.mean(axis=1).reshape(n_samples, -1)

print("Dataset consists of %d faces" % n_samples)
downloading Olivetti faces from https://ndownloader.figshare.com/files/5976027 to /home/circleci/scikit_learn_data
Dataset consists of 400 faces
Run Picard-O and FastICA for different number of sources, and store the elapsed time.
dimensions = [5, 10, 40, 60]

algorithms = [picard, fastica]
names = ['PicardO', 'FastICA']
colors = ['b', 'orange']

running_times = dict(FastICA=[], PicardO=[])
gradients = dict(FastICA=[], PicardO=[])
for n_components in dimensions:
    for name, algorithm in zip(names, algorithms):

        if name == 'FastICA':
            kwargs = dict(X=faces_centered.T, n_components=n_components,
                          random_state=rng, max_iter=500, tol=1e-10)
        else:
            kwargs = dict(X=faces_centered, n_components=n_components,
                          max_iter=500, tol=1e-5, random_state=rng)
        t0 = time()
        K, W, Y = algorithm(**kwargs)
        running_times[name].append(time() - t0)
        gradients[name].append(gradient_norm(Y))
/home/circleci/.local/lib/python3.8/site-packages/sklearn/decomposition/_fastica.py:494: FutureWarning: Starting in v1.3, whiten='unit-variance' will be used by default.
  warnings.warn(
/home/circleci/.local/lib/python3.8/site-packages/sklearn/decomposition/_fastica.py:120: ConvergenceWarning: FastICA did not converge. Consider increasing tolerance or the maximum number of iterations.
  warnings.warn(
Plot the results
def autolabel(rects, gradient_list):
    """
    Attach a text label above each bar displaying its height
    """
    for rect, gradient_norm in zip(rects, gradient_list):
        height = rect.get_height()
        g_string = '%.1e' % gradient_norm
        g_string = g_string[:5] + g_string[6:]
        ax.text(rect.get_x() + rect.get_width() / 2., height,
                'G=%.1e' % gradient_norm, fontsize=8,
                ha='center', va='bottom')


fig, ax = plt.subplots()
ind = np.arange(len(dimensions))
width = 0.8
for i, (name, color) in enumerate(zip(names, colors)):
    rect = ax.bar(2 * ind - 0.05 + i * (width + 0.1), running_times[name],
                  width=width, color=color, label=name)
    autolabel(rect, gradients[name])
ax.set_xticks(2 * ind + width / 2)
ax.set_xticklabels((str(n_components) for n_components in dimensions))
plt.legend()
plt.xlabel('Number of sources')
plt.ylabel('Time (sec.)')
plt.show()
Total running time of the script: ( 1 minutes 1.311 seconds)
